Seeing Shapes in Data: Using Topological Data Analysis to Detect Anomalies & Optimization Opportunities

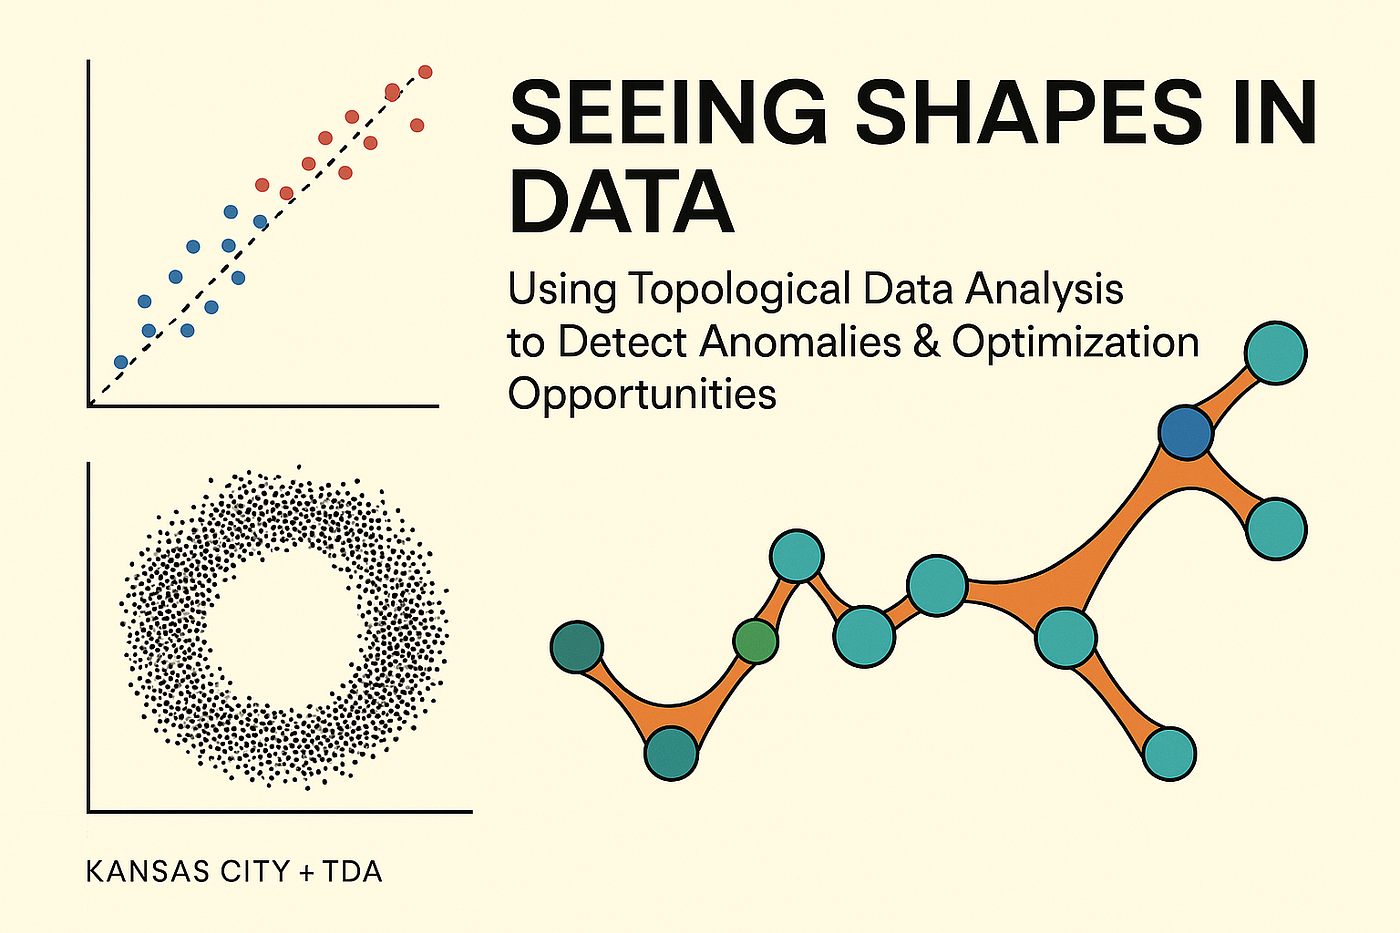
Introduction: From Rows and Columns to Shapes and Holes
Data scientists spend much of their time wrangling numbers into rows and columns. We build dashboards, regressions, and machine learning models that tell us which levers to pull. But if you’ve ever stared at a data lake with billions of points — clickstreams, customer journeys, sensor feeds — you know something feels missing. The data isn’t just a table. It’s a shape.
Imagine pouring a bucket of paint over your dataset in high-dimensional space. How does the paint flow? Does it pool in valleys (clusters)? Does it form tunnels (loops of behavior)? Are there voids — holes — where data should exist, but doesn’t? Those structures matter. They tell us about anomalies, inefficiencies, and opportunities hidden in the data geometry.
This is the world of Topological Data Analysis (TDA). While traditional statistics focus on averages and correlations, topology studies connectivity and shape. With TDA, we can step beyond pointwise analysis and detect global structures in our datasets — finding anomalies that regression misses and optimization pathways that clustering can’t see.
In this article, I’ll walk through:
- The principles of TDA and why shape matters in modern data.
- Python tools that make persistent homology and Mapper practical.
- Case studies: clickstream optimization, marketing funnels, fraud detection.
- Practical scaling tips for large datasets.
- A view of where data geometry fits in the next era of AI-driven analytics.
Why Shape Matters More Than Ever
The timing is right for TDA. Here’s why:
- Data lakes are bigger and noisier. Traditional clustering assumes separability, but user behavior data or IoT signals rarely behave cleanly. Shape-based methods are more resilient to noise.
- Optimization pressure is high. In marketing, operations, and finance, organizations want micro-optimizations. Even a 1% anomaly in a funnel could represent millions in revenue.
- Anomalies hide in structure. Fraud rings, security breaches, or bot loops often manifest as unusual shapes in data rather than simple outliers.
- AI models are black boxes. Topology can add explainability: why embeddings cluster in certain ways, or why a recommendation network has certain “bridges.”
In other words, TDA is less about novelty and more about necessity. When complexity increases, shape is the natural language.
Primer: Topology for Data Scientists
Topology is often introduced with the “donut vs. coffee cup” analogy: topologists care about holes and connectivity, not distances.
Three core concepts:
- Simplicial complexes: Building blocks (points, edges, triangles, tetrahedra) that approximate your data’s shape.
- Persistent homology: A technique that examines how features (clusters, loops, voids) persist across multiple scales of analysis.
- Mapper algorithm: A way of visualizing high-dimensional data as a network or shape map.
For data scientists, persistent homology is often the entry point: it tells you not just if clusters exist, but how stable they are as you vary the resolution.
Python Tools: Bringing Topology to Practice
Luckily, you don’t need to implement algebraic topology from scratch. Four major Python packages make TDA accessible:
- Giotto-TDA — scikit-learn compatible, production-friendly.
- Scikit-TDA — collection of TDA algorithms with nice visualization tools.
- Ripser.py — blazingly fast persistent homology.
- KeplerMapper — intuitive Mapper visualization for exploring dataset geometry.
For applied business analytics, giotto-tda is my preferred entry point. It fits neatly into pipelines and integrates with machine learning workflows.
Case Study 1: Clickstream Anomaly Detection
Consider an e-commerce platform analyzing millions of sessions. Traditional analytics might tell us bounce rate, conversion, or time on site. But what if the real anomaly lies in structure?
Users looping endlessly between category and cart.
Journeys with unexpected voids — no one ever clicks a logical next step.
Bizarre spikes of sessions that follow unlikely paths.
TDA allows us to capture these shapes of navigation.
Python Walkthrough
import numpy as np
from gtda.homology import VietorisRipsPersistence
from gtda.plotting import plot_diagram
from sklearn.preprocessing import StandardScaler

# Simulate clickstream features
np.random.seed(42)
sessions = np.random.rand(5000, 10)  # 5000 sessions, 10 features
scaler = StandardScaler()
X = scaler.fit_transform(sessions)

# Persistent homology
vr = VietorisRipsPersistence(metric="euclidean", homology_dimensions=[0, 1, 2])
diagrams = vr.fit_transform(X)

plot_diagram(diagrams[0])
📍 Insert Image 1: Persistence diagram showing anomalies in session flows
Interpretation:
- Long bars = real structures (like consistent navigation loops).
- Short bars = noise.
- A persistent loop might represent users “circling” a product without buying — an optimization point for UX.
Case Study 2: Optimizing Marketing Funnels
Funnels are supposed to be linear: Awareness → Consideration → Purchase. But in practice, customer journeys are messy.
With TDA:
- Clusters = user segments that behave similarly.
- Holes = drop-off points where customers vanish.
- Bridges = hidden pathways (e.g., users skipping directly from blog to checkout).
Mapper Example
import kmapper as km
from sklearn.cluster import DBSCAN
from sklearn.decomposition import PCA

mapper = km.KeplerMapper(verbose=1)
proj = mapper.fit_transform(X, projection=PCA(n_components=2))

graph = mapper.map(proj, X, clusterer=DBSCAN(eps=0.5, min_samples=10))
mapper.visualize(graph, path_html="funnel_mapper.html")
📍 Insert Image 2: Mapper visualization of funnel geometry
In practice:
- Large well-connected clusters = healthy funnel flow.
- Sparse or disconnected nodes = optimization targets.
- A disconnected cluster with high purchase rates? That’s a hidden shortcut worth amplifying.
Case Study 3: Fraud & Security
Fraudsters don’t follow typical transaction flows. They often create “rings” — circular money transfers, repetitive patterns, or gaps that hide activity.
Persistent homology detects loops where transactions circle endlessly. Mapper can show disconnected clusters of behavior that look nothing like normal customers.
This isn’t theoretical — financial institutions are piloting TDA for anti-money laundering because it detects structure where anomaly scores fall short.
Scaling TDA to Large Datasets
One of the biggest criticisms of TDA is scale. Persistent homology computations can explode combinatorially. Here’s how practitioners address it:
- Subsampling + bootstrapping — Random subsets retain global shape.
- Feature embeddings — Use PCA, UMAP, or autoencoders before TDA.
- Streaming homology — Update topology incrementally as new data arrives.
- Ripser++ / parallelization — GPU-enabled TDA speeds up by orders of magnitude.
In practice, you don’t need every single data point — just enough to approximate the shape.
TDA Meets Machine Learning
One of the most exciting trends is combining TDA features with ML:
- Extract persistence diagrams → convert into vector features → feed into XGBoost or deep learning.
- Use Mapper graphs as feature-rich embeddings.
- Apply TDA to embeddings themselves — e.g., analyzing the geometry of word embeddings or user embeddings.
This creates hybrid models that are both predictive and explainable.
Beyond Analytics: Data Geometry as Strategy
Why should executives care about topology? Because anomalies and optimizations aren’t just technical — they’re business.
- A persistent loop in clickstream data = UX design flaw costing millions.
- A hole in a marketing funnel = drop-off point ripe for automation.
- A bridge connecting clusters = cross-sell opportunity across segments.
Topology reframes analytics from descriptive KPIs to structural insights. Instead of just “conversions are down 5%,” we can say: “There’s a hole in the funnel between steps three and four — patch it, and conversions rebound.”
The Future: TDA in AI & Complex Systems
We’re entering a phase where AI models generate massive embedding spaces. Understanding the geometry of those embeddings is critical:
- AI safety — detect anomalous hidden states in LLMs.
- Search & SEO — analyze the shape of embedding spaces for content clustering.
- Econometrics — detect anomalies in macroeconomic data flows.
- Operations — find systemic inefficiencies in logistics networks.
In my own work on algorithmic marketing and econometrics, I see TDA as a bridge between data geometry and optimization strategy. It’s not just a tool — it’s a way of thinking about data.
Conclusion: The Shape of Insight
Topological Data Analysis shifts the conversation. Instead of asking “what’s the average,” we ask “what’s the shape?”
In a world of massive, messy, high-dimensional data, this shift matters. Shape reveals anomalies that dashboards miss. Shape uncovers optimization pathways executives crave. And shape ties analytics back to strategy.
If your datasets feel too big, too complex, or too noisy, maybe it’s time to stop flattening them into tables and start exploring their geometry. Because sometimes, the insight isn’t in the points. It’s in the holes.
About the Author
Brian Curry is a Kansas City based Data Scientist, Artificial Intelligence expert and founder of Vector1 Research, a part time passion project, where he explores the frontier of Artificial Intelligence, SEO, Agentic Systems, Machine Learning, Economic Systems, Marketing Modeling, and Econometrics. His work focuses on building intelligent systems that reveal the causal structures driving performance across marketing, content, and economics and the creator of Papilon, an open-source framework for complex system optimization, Daedalus, a platform for causal and economic analysis, and the scientist behind Memory-Node Encapsulation (MNE): A Revolutionary Data Structure for Artificial Episodic Memory and Cognitive AI Reasoning.
© 2025 Brian Curry. All rights reserved. Original models, frameworks, and conceptual structures are proprietary intellectual property. Do not reproduce without permission.
References
- Ghrist, R. (2008). Barcodes: The persistent topology of data. Bulletin of the AMS.
- Carlsson, G. (2009). Topology and data. Bulletin of the AMS.
- Chazal, F., Michel, B. (2021). An introduction to Topological Data Analysis: fundamental and practical aspects for data scientists.
- Singh, G., Mémoli, F., Carlsson, G. (2007). Topological Methods for the Analysis of High Dimensional Data Sets and 3D Object Recognition.
- Giotto-TDA Documentation
- Scikit-TDA
- Brian Curry, Research on Algorithmic Marketing & Complex Systems (Medium, 2025).


